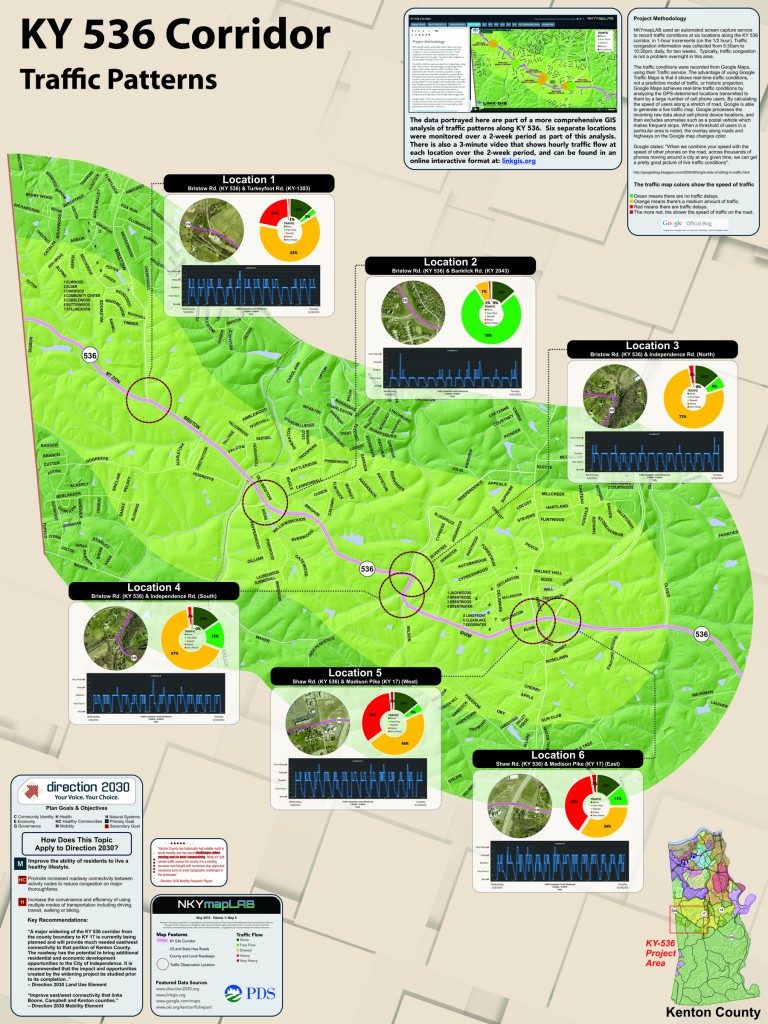
The overall goal of this analysis is to further examine traffic flow and traffic congestion along the KY 536 Corridor (western portion). Traffic counts and turn analysis studies have been completed to better understand the traffic flow patterns in this area, but those studies are much more technical, and typically completed for the engineering industry. This analysis is qualitative, and provides a more basic understanding of traffic flow to everyday users of this corridor, and residents of this community.
Project Methodology
NKYmapLAB used an automated screen capture service to record traffic conditions at six locations along the KY 536 corridor, in 1-hour increments (on the 1/2 hour). Traffic flow/congestion information was collected from 5:30am to 10:30pm, daily, for two consecutive weeks. Typically, traffic congestion is not a problem overnight in this area. Although traffic information was collected for the overnight period, it was not included in the analysis charts.
The traffic conditions were recorded from Google Maps, using their Traffic service. The advantage of using Google Traffic Maps is that it shows real-time traffic conditions, not a predictive model of traffic, or historic projection. Google Maps achieves real-time traffic conditions by analyzing the GPS-determined locations transmitted to them by a large number of cell phone users. By calculating the speed of users along a stretch of road, Google is able to generate a live traffic map. Google processes the incoming raw data about cell phone device locations, and then excludes anomalies such as a postal vehicle which makes frequent stops. When a threshold of users in a particular area is noted, the overlay along roads and highways on the Google map changes color.
The traffic map colors show the speed of traffic. The colors indicate traffic flow: Green means there are no traffic delays; Orange means there’s a medium amount of traffic; Red means there are traffic delays; The more red, the slower the speed of traffic on the road.
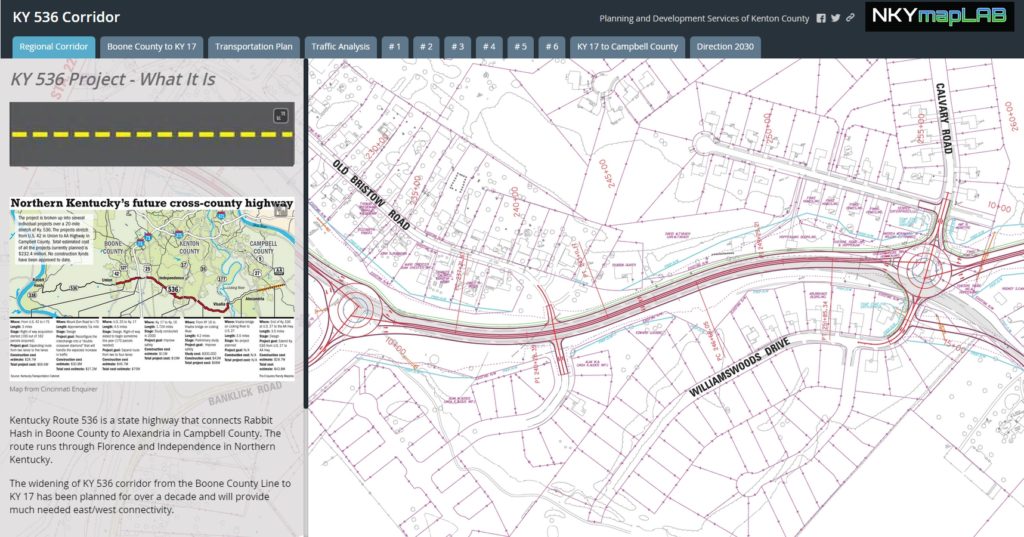
POSTSCRIPT: The Story Map of which this is a part may be found here. By the end of this Story Map experience, viewers will have a better understanding of traffic conditions along the western portion of the KY 536 Corridor. One of the highlights of the Story Map is a 3:40 video that shows animated traffic conditions along the corridor over a 2-week time period in May.


