
Flood Information
Flood zone data is sourced from the Federal Emergency Management Agency (FEMA) and is available in the LINK-GIS map viewer. The flood zone layers are on by default but will not appear until zoomed in several levels on the map.
Viewing Flood Zone Layers on the Map
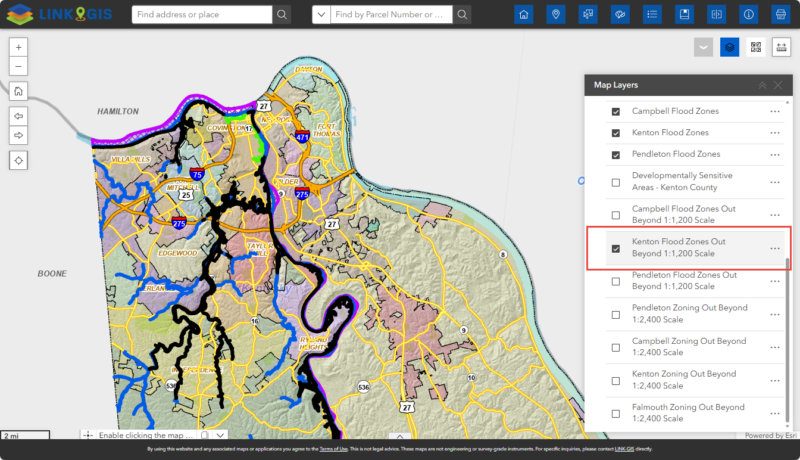
- In the LINK-GIS map viewer, hover on the gray box with white stacked squares on the upper right of the viewer. The hover text reads “Map Layers”. When clicked, it expands, showing several groups of map layers that can be turned ON and OFF.
- Locate the ‘Zoning and Flood Layers’ group by scrolling through the list or typing in the search bar at the top of the panel. Click the gray triangle on the left side of the group name to expand it.
- Scroll down to find the flood zone layers.” Check the box next to a layer name to turn it ON and make sure the box next to the group name is also checked. Uncheck a box to turn a layer OFF.

- To adjust transparency for all layers in the group, click the three dots on the right side of the “Zoning and Flood Layers” group header.
- You can also visualize the Flood Zone Beyond X scale by scrolling down within the flood zone layers group.
It is recommended to view the flood zone layers on top of the “Aerial” basemap to see if structures are in or out of a flood zone.
Looking Up Flood Information for a Specific Parcel
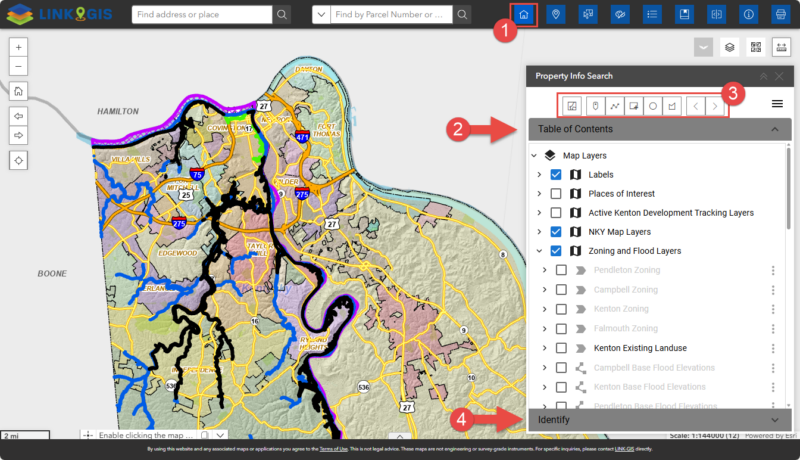
- In the LINK-GIS map viewer, Click the house icon in the upper right corner of the map viewer to open the “Property Search Info” widget.
- Check the “Zoning and Flood Layers” option from the “Table of Contents” list to include flood information in your results.
- Select parcels by point, line, or area using the options in the widget menu.
- Once parcels are selected, the widget updates with information for the selected parcels in the “Identify” section. By default, it displays Community, Service, School, and Political information. Scroll to the bottom of the results to find the FEMA Floodplain information.
- You can adjust the height of the results panel by dragging the gray bar up or down.
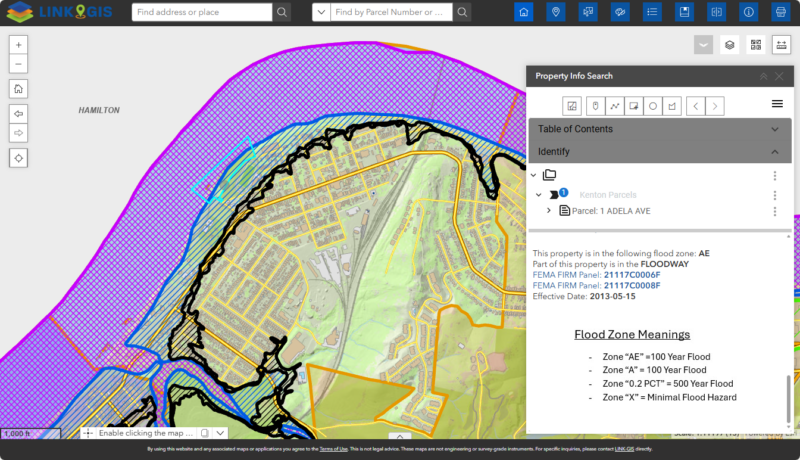
- To close the widget, click the “X” in its upper right corner or click its icon in the toolbar.