
Draw Widget
The Draw widget is a tool for drawing graphics on the LINK-GIS map viewer. Graphics that are drawn on the map viewer will also display when a printable map is generated. Open the Draw widget by clicking the Draw icon in the toolbar. The icon looks like a painter’s pallet.
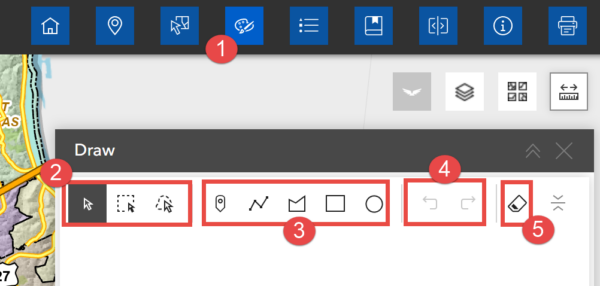
- Open the Draw widget (1) and select a drawing mode.
- Choose a drawing option from the available choices. Hover over an option to see its type (3). The selected option will appear over a black square.
- To Edit selected vertices or change the position of the geometry made, use the select tool (2)
- Undo or redo changes (4)
- Click Clear (5) to remove all graphics from the map viewer.
- Close the widget by clicking on the “x” in the upper right-hand corner of the widget or clicking its icon in the toolbar.
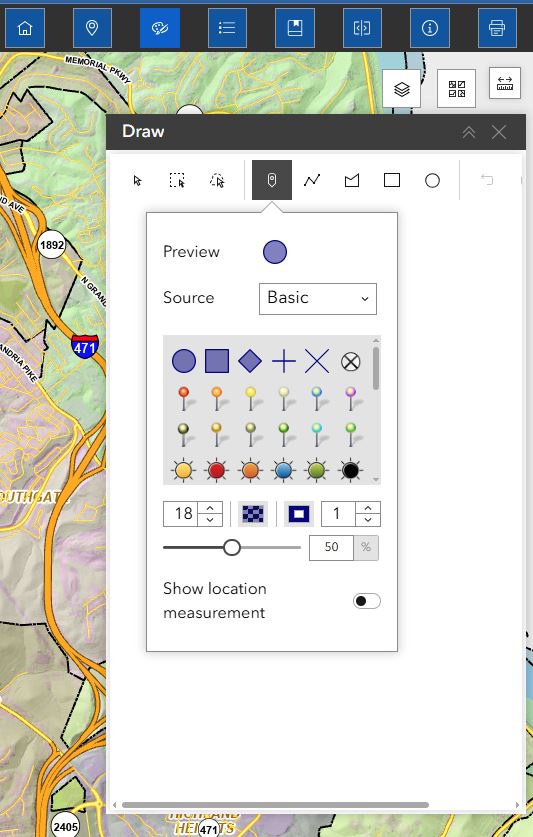
Drawing points:
- Select the Point drawing mode from the Draw widget.
- Choose a symbol from the Symbol Category dropdown. Each category provides different symbols.
- Customize the symbol by adjusting size, color, transparency, outline color, and outline width.
- Click on the map to place the point.
- To add additional points, repeat the selection and placement steps.
- Select one or multiple points, then click Delete to remove them.
- Click Clear to remove all graphics from the map viewer.
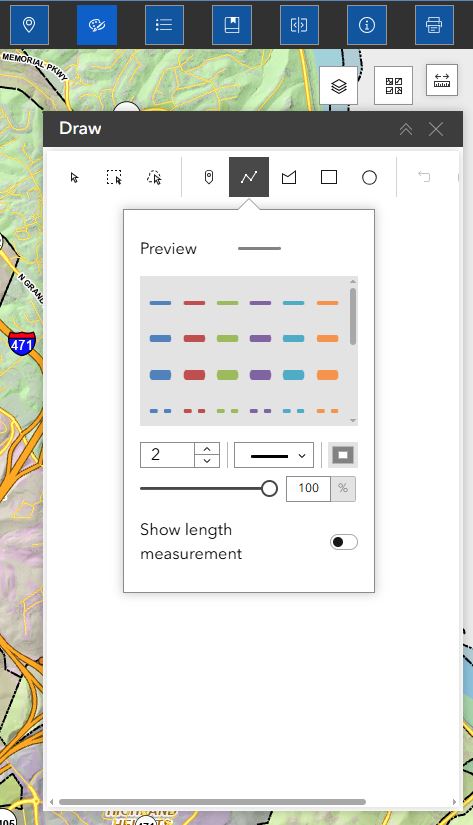
Drawing lines:
- Select the Line drawing mode from the Draw widget.
- Choose a line type from the available options.
- Customize the line by adjusting color, size, transparency, and width.
- Toggle the Show length measurement button to display measurements for lines. Use the “Distance Units” button to select the desired units. Measurements appear once the line is completed.
- Click on the map to begin drawing the line, then double-click to finish.
- To add additional lines, repeat the selection and drawing steps.
- Click Undo to remove the last line drawn. (available only while drawing)
- Click Redo to restore the last undone line. (available only while drawing).
- Click Clear to remove all graphics from the map viewer.
- Select one or multiple lines, then click Delete to remove them.
- Double-click on the map to finish drawing the line.
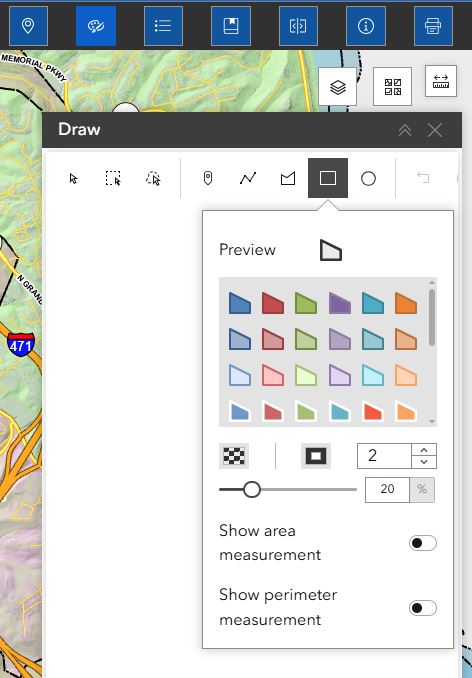
Drawing polygons:
- Select a Polygon drawing mode from the Draw widget, then choose a polygon type.
- Customize the polygon by adjusting color, size, transparency, outline color, and outline width.
- Toggle the Show area measurement and Show perimeter measurement buttons to display measurements for polygons. Use the “Area Units” and “Distance Units” buttons to select the desired units. Measurements appear once the polygon is completed.
- Click on the map to begin drawing the polygon, then follow the prompts. Double-click to finish.
- To add additional polygons, repeat the selection and drawing steps.
- Click Undo to remove the last line drawn. (available only while drawing)
- Click Redo to restore the last undone vertex. (available only while drawing).
- Click Clear to remove all graphics from the map viewer.
- Select one or multiple polygons, then click Delete to remove them.
- Double-click on the map to finish drawing the polygon.
See it in Action
Watch the video below for a step-by-step demonstration.