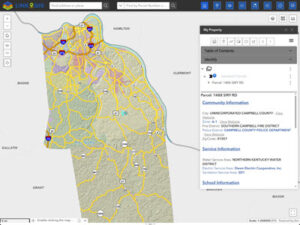
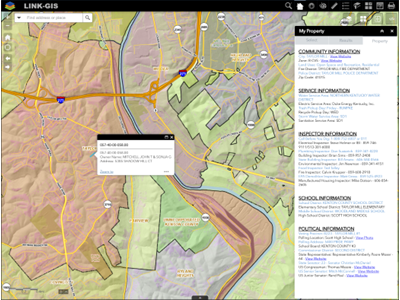
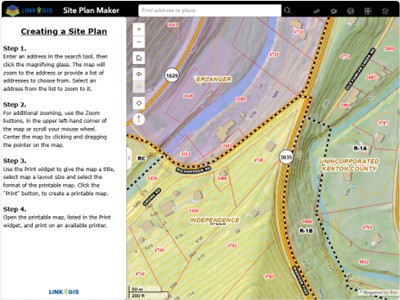
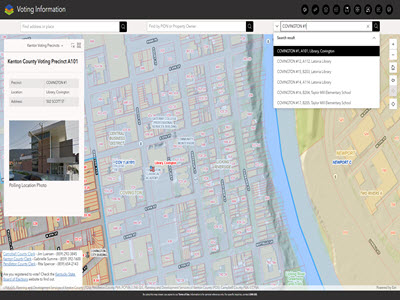
Maps & Apps
View our online selection of Maps & Applications that are available publicly at no cost.

Disclaimer Regarding Information: The information is provided via this website as a public service. Please note that users are responsible for checking its accuracy, completeness, currency, and/or suitability themselves. This may require inspection of official public records housed by the individual jurisdictions involved. Read Full Disclaimer