
LINK-GIS Solutions
We are solutions oriented. The LINK-GIS team uses an assortment of digital tools to improve decision-making and operational efficiency. Using GIS and geospatial data, we design interactive maps, apps, dashboards, and spatial analysis tools to visualize trends, patterns, and insights. Leveraging Python and automation tools (like ArcPy, Power Automate, or GeoPandas), we streamline data processing, data collection, automate workflows, and integrate near real-time data. We also develop custom web and desktop GIS applications, APIs, and tools to support urban planning, community development, asset management, emergency response, public works, and zoning needs. Our goal is to transform complex spatial data into actionable information for smarter, faster decisions.
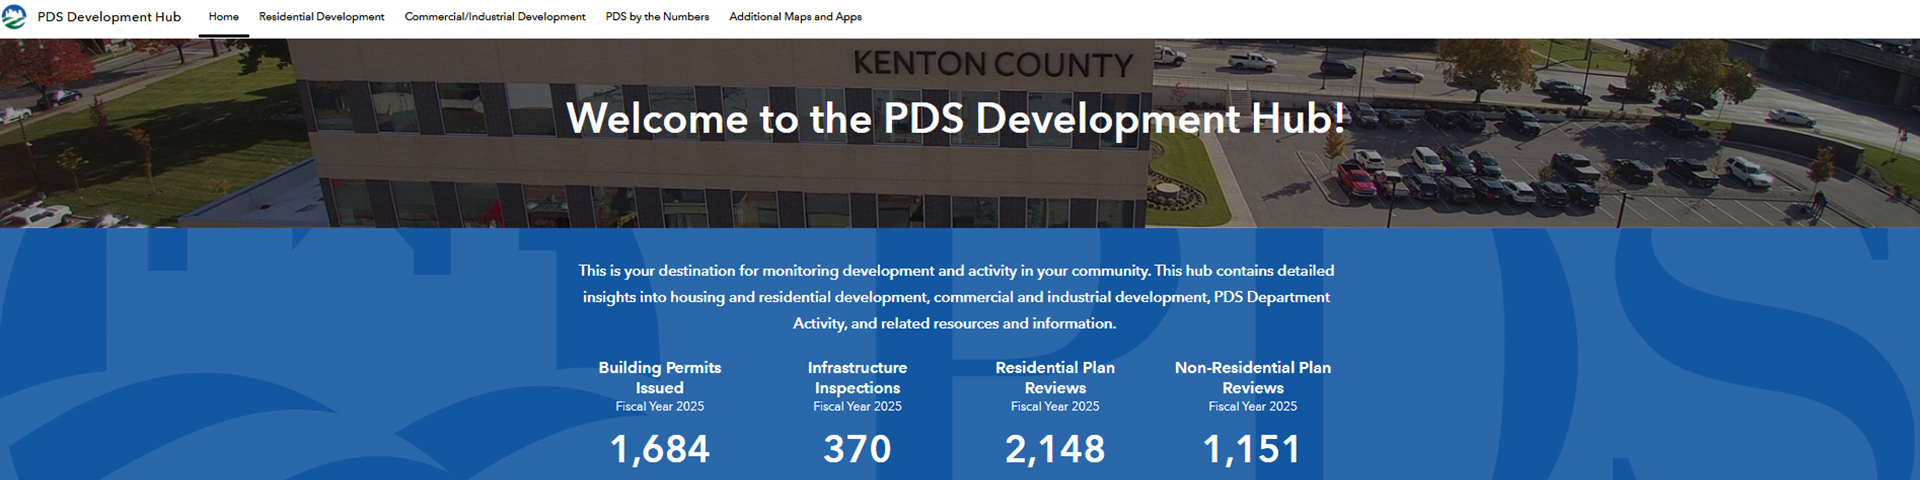
PDS Development Hub
A Hub site is an easy-to-configure community engagement platform that organizes people, data, and tools through information-driven initiatives. In this case our Hub site is organized around development data. The PDS Development Hub is your destination for monitoring development and activity in Kenton County communities. This Hub contains detailed insights into housing and residential development, commercial and industrial development, PDS Department Activity, and other authoritative and related resources and information.
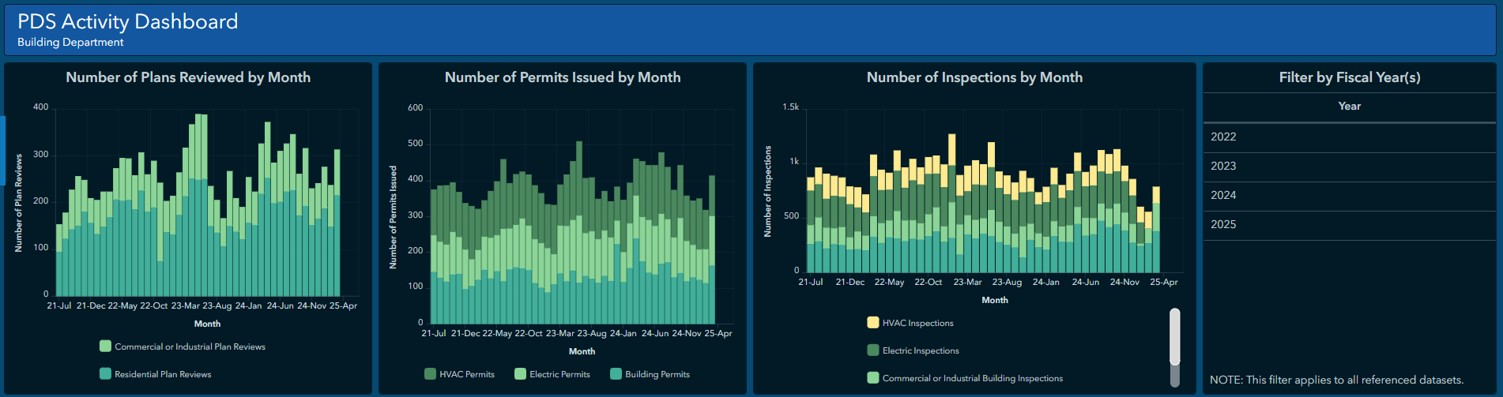
Data at a Glance: Interactive Dashboards
The LINK-GIS consortium manages data across many communities in Northern Kentucky, especially data about development activity. Decisions that relay on this data are constantly happening somewhere and our goal is to make sure that when those decisions are made, they are based on the most up to date data available. The LINK-GIS approach to support this decision-making process has been to centralize the data in dashboards where data and maps come together to provide information, which then helps answer questions and bring insight of the trends happening within our communities. These dashboards are visual displays that present data in an easy-to-read format. All relevant information can be seen on a single screen, facilitating understanding quickly and easily. The LINK-GIS strategic dashboards help leaders track key performance indicators (KPIs) and make strategic decisions by evaluating performance based on agency and community goals.
Using LiDAR to Classify Features Based on Elevation Differences
The LINK-GIS team regularly uses LiDAR in providing solutions. LiDAR (Light Detection And Ranging) is a method of collecting three-dimensional elevation data as points. Each point has an X, Y, and Z location (latitude, longitude, elevation). In this case, the LINK-GIS team used a combination of LiDAR and geoprocessing tools to study elevation differences and help classify data. In this case, the classification helped automate the determination of decks (elevated pervious or permeable structures) vs. patios (at-grade impervious surfaces) within the building structures GIS data layer. This solution took hours to implement, as compared to days or weeks that would be required to manually sort through the data. The geoprocessing tools sorted through 60,800+ map features and compared each feature’s elevation to the surrounding elevation, and then classified the map feature, all in a matter of hours.

Field Data Collection: GIS & GPS
The LINK-GIS consortium develops apps to help communities and agencies capture data while out in the field. Data can be captured, edited, and verified live in the field without the need to rely on taking printed paper maps out of the office. Frequently the field data capture is performed using GPS signals. The accuracy of the GPS signal is dependent on the device being used, and whether or not an external antenna is being used to improve the signal accuracy. LINK-GIS uses the Trimble R1 GNSS receiver, which pairs with a smartphone (or tablet) via Bluetooth and will act as the receiver when retrieving a GPS signal in the app. The Trimble R1 receiver is designed for GIS data collection and asset management. The Trimble R1 integrates seamlessly with iOS and Android devices, allowing for much greater precision than only using the device by itself.

Using Python & Model Builder to Depict Scenarios and Outcomes
The LINK-GIS team uses ArcGIS Pro and Esri’s Model Builder to provide technical support in many situations to model scenarios and outcomes around Northern Kentucky. In this example Python and Model Builder is being used to help Kenton County cities, and the Kenton County Planning Commission, translate Article 8 (Natural Resources and Environmental Standards) of the Kenton County Z21 Zoning Ordinance into a stand-alone tool that allows the user to create and evaluate riparian buffers based on a combination of stream type (perennial vs. intermittent), stream width, slope, and surrounding land use. This also helps communities evaluate how competitive their community is when it comes to economic development, and quality of life. Being a voluntary effort, each city decides what regulations and exceptions would apply to their jurisdiction. Local elected officials are free to continue, or withdraw, their community’s participation in the effort.

The first stage of the data model is to create three slope levels from a Digital Elevation Model. Next, the perennial and intermittent stream data are established for the model, this data is available in both line and polygon geometry. Sanitation District No.1 (SD1) is a LINK-GIS member, and provided the perennial and intermittent stream data as line geometry. PDS (the managing member of LINK-GIS) provided stream polygon data for steams with a measurable width of 20 or more feet. To determine the Residential and Non-Residential land uses, PDS’ Existing Land Use data was used.
The Z21 Riparian Buffer data model is completely customizable per the zoning ordinance. This allows each city to customize the inputs and buffer distances through the model as parameters. This allows cities to quickly and efficiently model different scenarios, or model scenarios where new data has been made available.

Twilio and Power Automate
The LINK-GIS team relies heavily on automation to extend its’ capabilities. Twilio can notify team members that certain automation tasks have been completed successfully, and determine how long a task takes to run. The LINK-GIS team uses Twilio, combined with Microsoft’s Power Automate, as a reporting tool to monitor applications in real-time along with scheduled automation processes. In addition, Twilio is also used to alert team members when an automation does not run as expected, if map services are not running correctly, or if a website is down or not responsive. As a result, Twilio and Power Automate help LINK-GIS improve the way we respond to the needs of our agency, our partner organizations, residents, and customers.

Kenton County School Finder – Search Form Powered by GIS Data
The LINK-GIS team built the Kenton County School Finder application to allow users to quickly identify the school district(s) that an address is assigned to. The search is open to the public and returns a list with the Elementary, Middle and High school for the input address. Although this application does not directly use maps (ie. no map is displayed to the user), the application relies extensively on geospatial mapping data on the back end to query the location of an address and determine its’ position within the elementary, middle, and high school district GIS data layers.

NG911 Data: Assigning Parity for Address Ranges on Streets
LINK-GIS manages Next Generation 911 (NG911) data submissions on behalf of several Public Safety Answering Points (PSAPs). The Kentucky 911 Services Board (which reports to the Executive Director of the Kentucky Office of Homeland Security) has developed requirements for PSAPs, which are responsible for receiving 911 calls and processing those calls according to a specific operating policy, to operate effectively in a legacy Enhanced 911 (E911) environment.
The Road Centerline data layer, maintained by LINK-GIS, is one of the data layers required to be submitted to the KY911 Services Board’s data portal. Across the state, these layers are used by the Emergency Call Routing Function (ECRF) and the Location Validation Function (LVF) portion of NG911. The data layer schema is primarily based on the “NENA Standard for NG9-1-1 GIS Data Model” document (NENA-STA-006.1.1-2020, DSC Approval: 02/18/2020).

The rapid growth and ongoing development in Northern Kentucky have highlighted the need for tools that streamline data entry processes and minimize the time spent on manual input. In response, a custom tool was designed to automatically evaluate address parity along street centerlines. In address matching, parity is used to locate a geocoded address on the correct side of the street (often odd addresses on the left side, even addresses on the right side, but not always).
By analyzing house numbers in the attribute table, the tool’s automated code determines whether addresses on the left and right sides are even, odd, zero, or both, and assigns the appropriate parity accordingly. This tool can be run regularly to detect changes and updates to the data as development changes the built world. This solution is adaptable for use in other counties, making it a scalable solution for improving data efficiency and accuracy across the region.